
Dashboard & Clients
The Dashboard is where you land when you log in. It gives you your whole client portfolio at a glance: a row of KPI cards up top, an Upsell & Services view that turns your clients' insurability assessments into a revenue picture, and the full Client List underneath. Every client has their own isolated environment, but from here you see them all together.
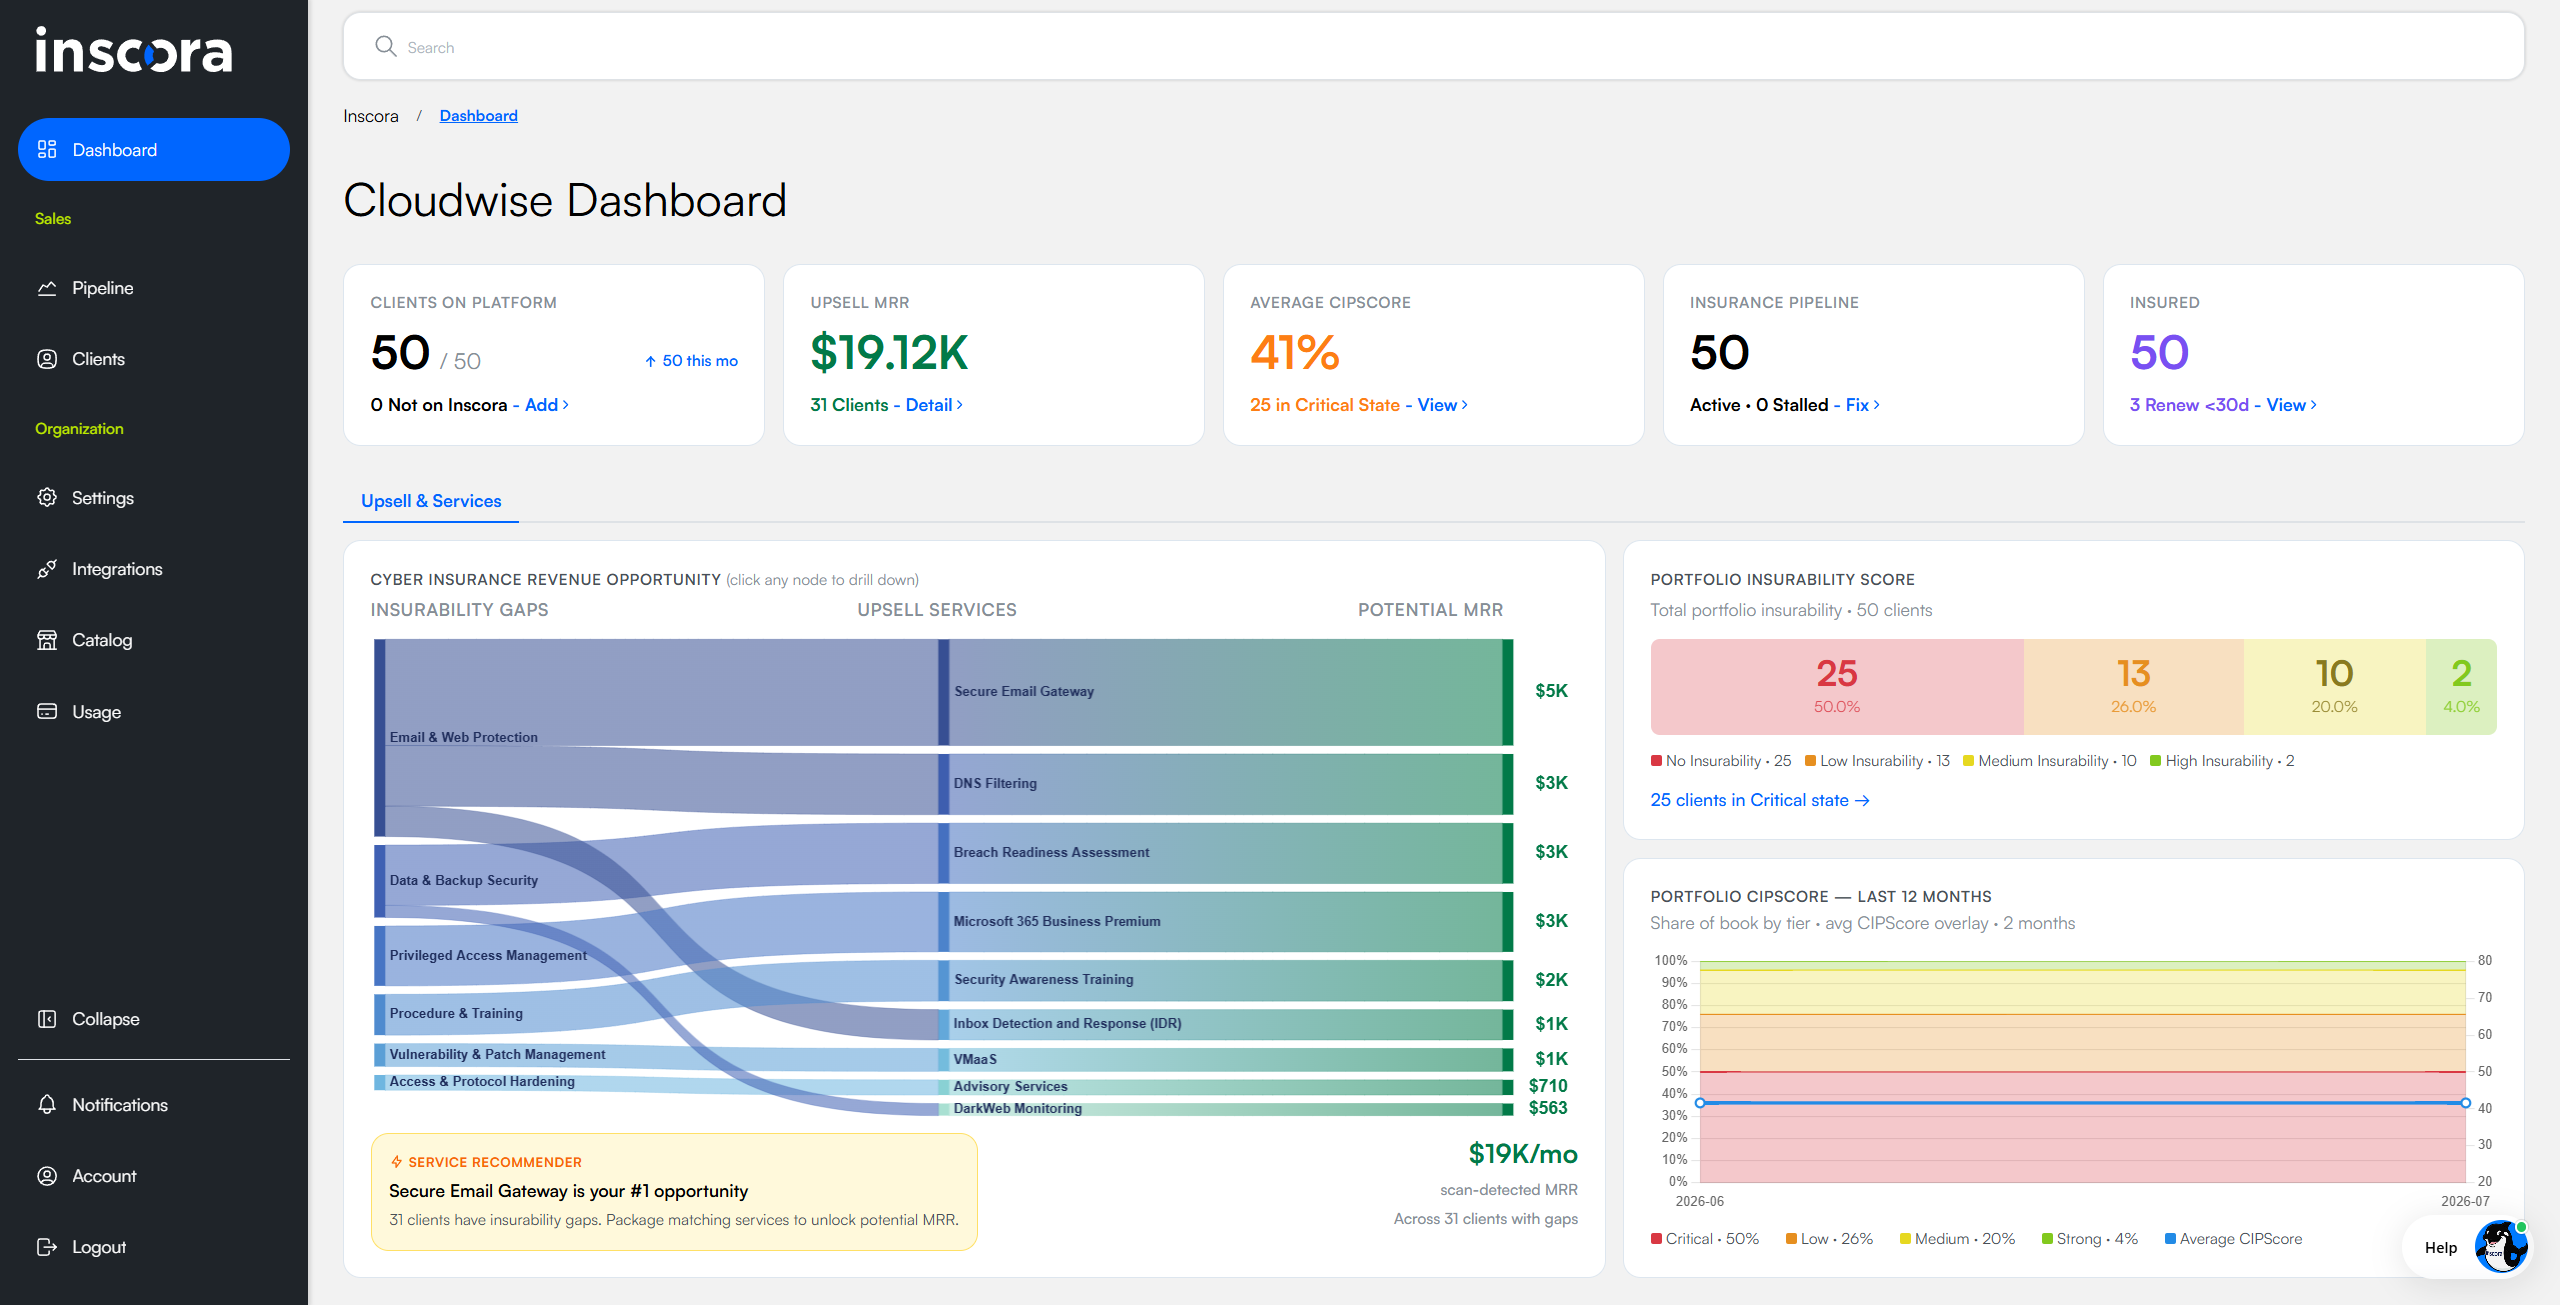
The MSP Dashboard: KPI cards on top, then the Upsell & Services view.
Portfolio KPI Cards
A row of KPI cards runs across the top of the Dashboard. Each card represents an actionable metric allowing you to efficiently manage your entire client portfolio's insurability. Selecting a card (or its footer link) opens the Client List already filtered to the clients behind that number, so you go straight from "what's happening" to "what to act on."
Card | What it shows | What it allows you to do |
|---|---|---|
Clients on Platform | How many of your clients are monitored on Inscora, out of your total that is visible from your PSA (or imported but not monitored), with a count of new ones this month. | Open the clients that aren't monitored yet (shown as Warning in the Monitoring column) and add them to Inscora. |
Upsell MRR | The total monthly recurring revenue opportunity across your book, based on the insurability gaps found in each client's assessment (insurability scan results and questionnaire answers today, and connected integrations in the future) matched to the offers in your Service Catalog. | Work the clients that have gaps, sorted by opportunity, to prepare a QBR and pitch the matching services. |
Average CIPScore | Your portfolio's average Cyber Insurability Posture Score, with a trend indicator. | Prioritize the clients in a critical state (scoring low) for remediation. |
Insurance Pipeline | How many clients are active in the insurance journey, and how many are stalled. | Find and unblock the stalled clients that need a nudge. |
Insured | How many clients are insured, and how many renew soon. | Ensure the clients renewing soon are in a good insurability state. |
💡 Upsell MRR needs catalog prices. The Upsell MRR figure is calculated from your enabled Service Catalog offers and their prices. If you haven't set prices yet, the Dashboard shows the number of client opportunities instead of a dollar figure. Add prices in the catalog to project revenue.
Global Search
At the top of every page you'll find a Search bar. Type a client name or website domain and results appear right away. Click one to go straight to that client's page. This is the fastest way to find a client, especially as your portfolio grows.
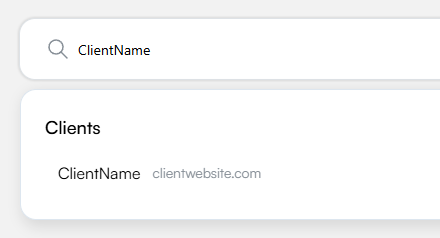
Searching for a client by name. Results show the client name and their website domain.
💡 The search bar works from any page in Inscora. You don't need to go back to the Dashboard to find a client.
Upsell & Services
The main area of the Dashboard is the Upsell & Services view. It turns each client's insurability into a revenue picture: where your clients have insurability gaps, which of your services close those gaps, and what new revenue opportunity this represents.
Cyber Insurance Revenue Opportunity
This flow chart reads left to right in three columns: Insurability Gaps (the CIPScore control areas where clients are failing) flow into Upsell Services (the catalog offers that address each gap), which flow into Potential MRR (the monthly revenue if they purchased that additional service).
Switching between revenue and client count
A switch in the chart's top-right corner changes what the third column measures. On the $ setting the flows are sized by revenue and the column reads Potential MRR. Switch to the person setting and the flows are sized by how many clients sit behind each service, with the column reading Potential clients and a client count on every row.
Use the client view when you want to know how many conversations a gap is worth rather than how much money: who to call this week, rather than what to forecast. The running total in the bottom-right corner stays in MRR either way, so you keep the revenue figure in view while you work through counts.
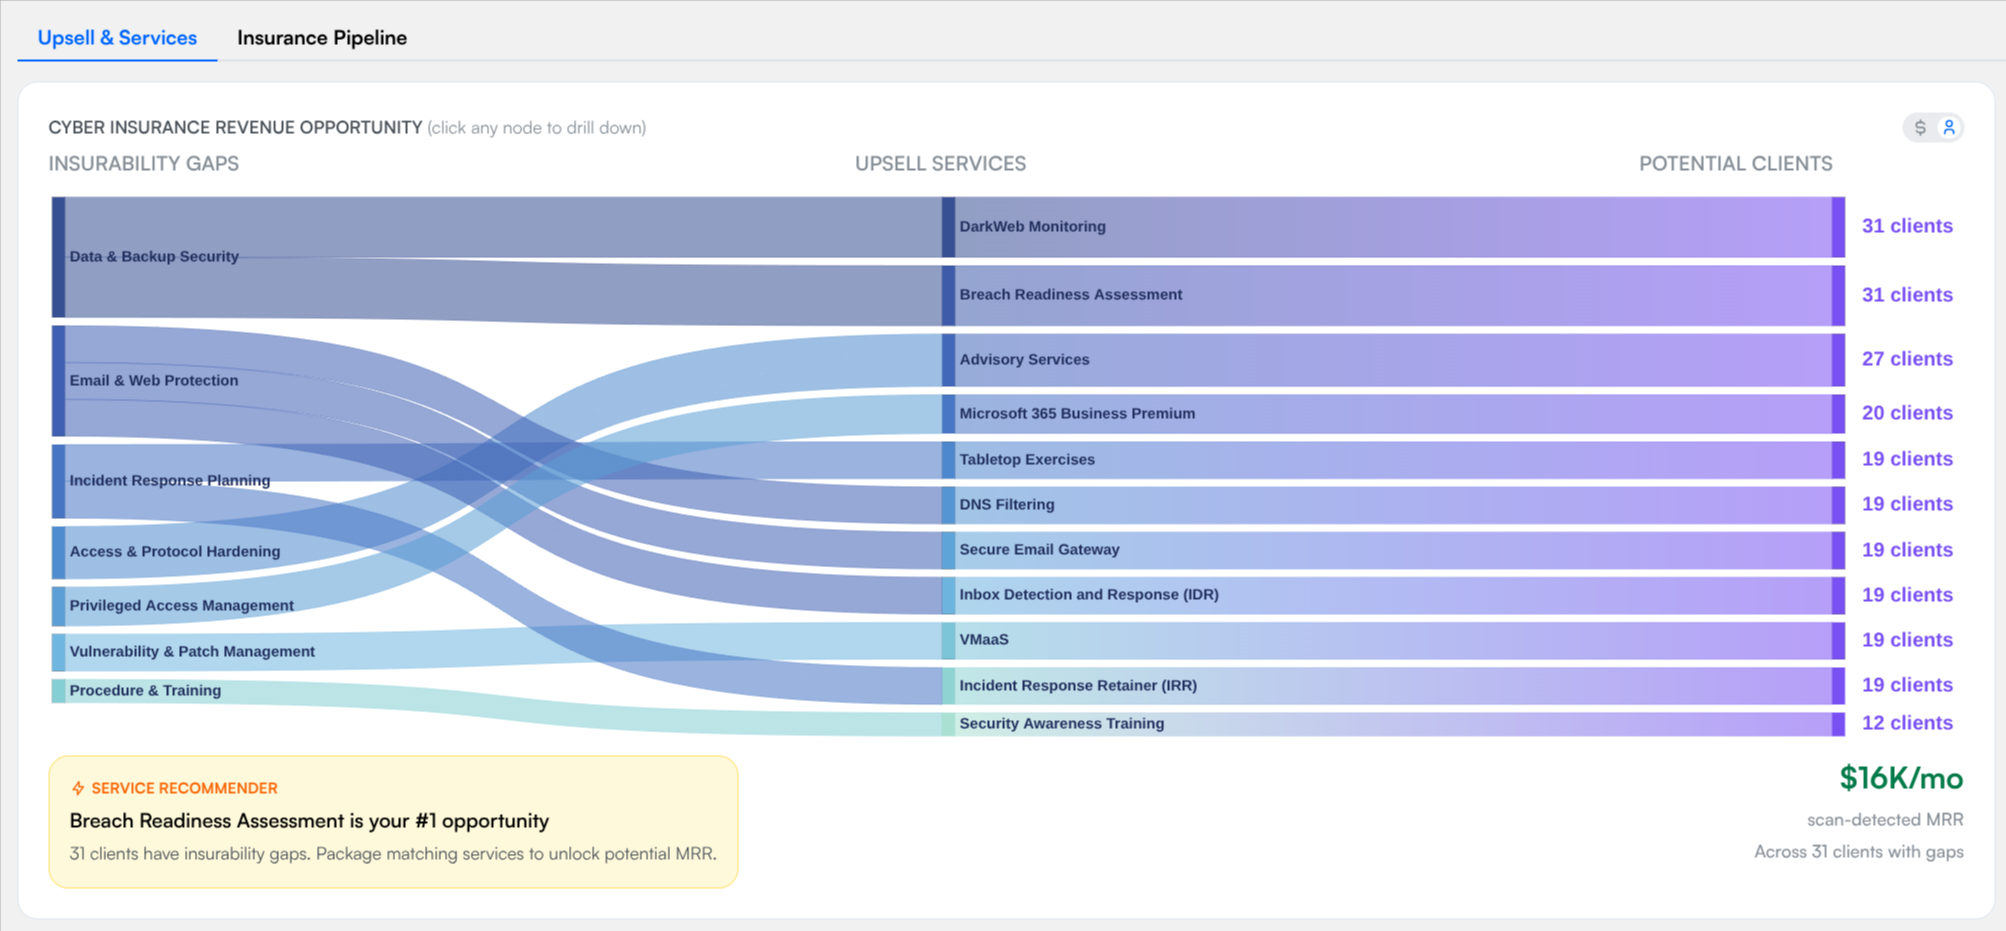
The Cyber Insurance Revenue Opportunity chart in the client-count view. The switch sits in the top-right; the third column shows how many clients sit behind each service.
ℹ️ The switch needs catalog prices. It only appears once your Service Catalog has prices on it. Without them Inscora has no revenue figure to show, so the chart stays on Potential clients and there is nothing to switch between. Add prices to unlock the revenue view.
The chart is interactive: click any node to drill down. Click a gap to open the Client List filtered to the clients with that gap, or click a service to filter to the clients who need it. Below the chart, the Service Recommender highlights your single biggest revenue opportunity - the service that would close gaps for the most clients - so you know what to package and pitch first. A running total shows the potential MRR across the clients with gaps.
Portfolio Insurability Score
A distribution bar shows how your whole portfolio breaks down by insurability. Clients fall into four color-coded tiers:
Tier | Color | Meaning |
|---|---|---|
High Insurability | 🟢 Green | Strong posture. Likely to be well received by carriers. |
Medium Insurability | 🟡 Yellow | Moderate posture. Some areas to improve. |
Low Insurability | 🟠 Orange | Weak posture. Significant gaps to address. |
No Insurability | 🔴 Red | Critical gaps that would likely block cyber insurance readiness. |
A link takes you straight to the clients sitting in the critical tier.
Portfolio CIPScore Over Time
A trend chart shows your portfolio's insurability over time: the mix of clients in each tier month by month, with your average CIPScore drawn as a line on top. The window grows as you use Inscora: it starts at a single month and extends each month (two months, three months, and so on) up to a rolling 12-month maximum, so early on you'll see a shorter span. Use it to see whether your portfolio is getting more insurable as you remediate, and as a talking point in reviews.
Client List
Below the insights is a sortable table of all your clients. Each row shows:
Column | Description |
|---|---|
Name | The client organization name and their website domain. Click it to open that client's page. |
Upsell MRR | The monthly revenue opportunity for that client, based on their gaps and your catalog prices. |
Cyber Insurability score | The client's CIPScore as a color-coded bar and percentage. |
Last Scanned | The date of the most recent insurability scan. Inscora re-scans every client automatically every 30 days. |
Monitoring | The client's monitoring status: Monitored, Warning (shown when the client has no website, so it can't be scanned), or a dash when not applicable. |
Renewal Date | When the client's cyber insurance policy is due for renewal. |
Premium | The client's current or quoted cyber insurance premium. |
Click any column header to sort. The table paginates, with a rows-per-page control at the bottom. Two more columns, Insurability Gaps and Upsell Services, are hidden by default; they power the matching filters and the drill-downs from the revenue opportunity chart.
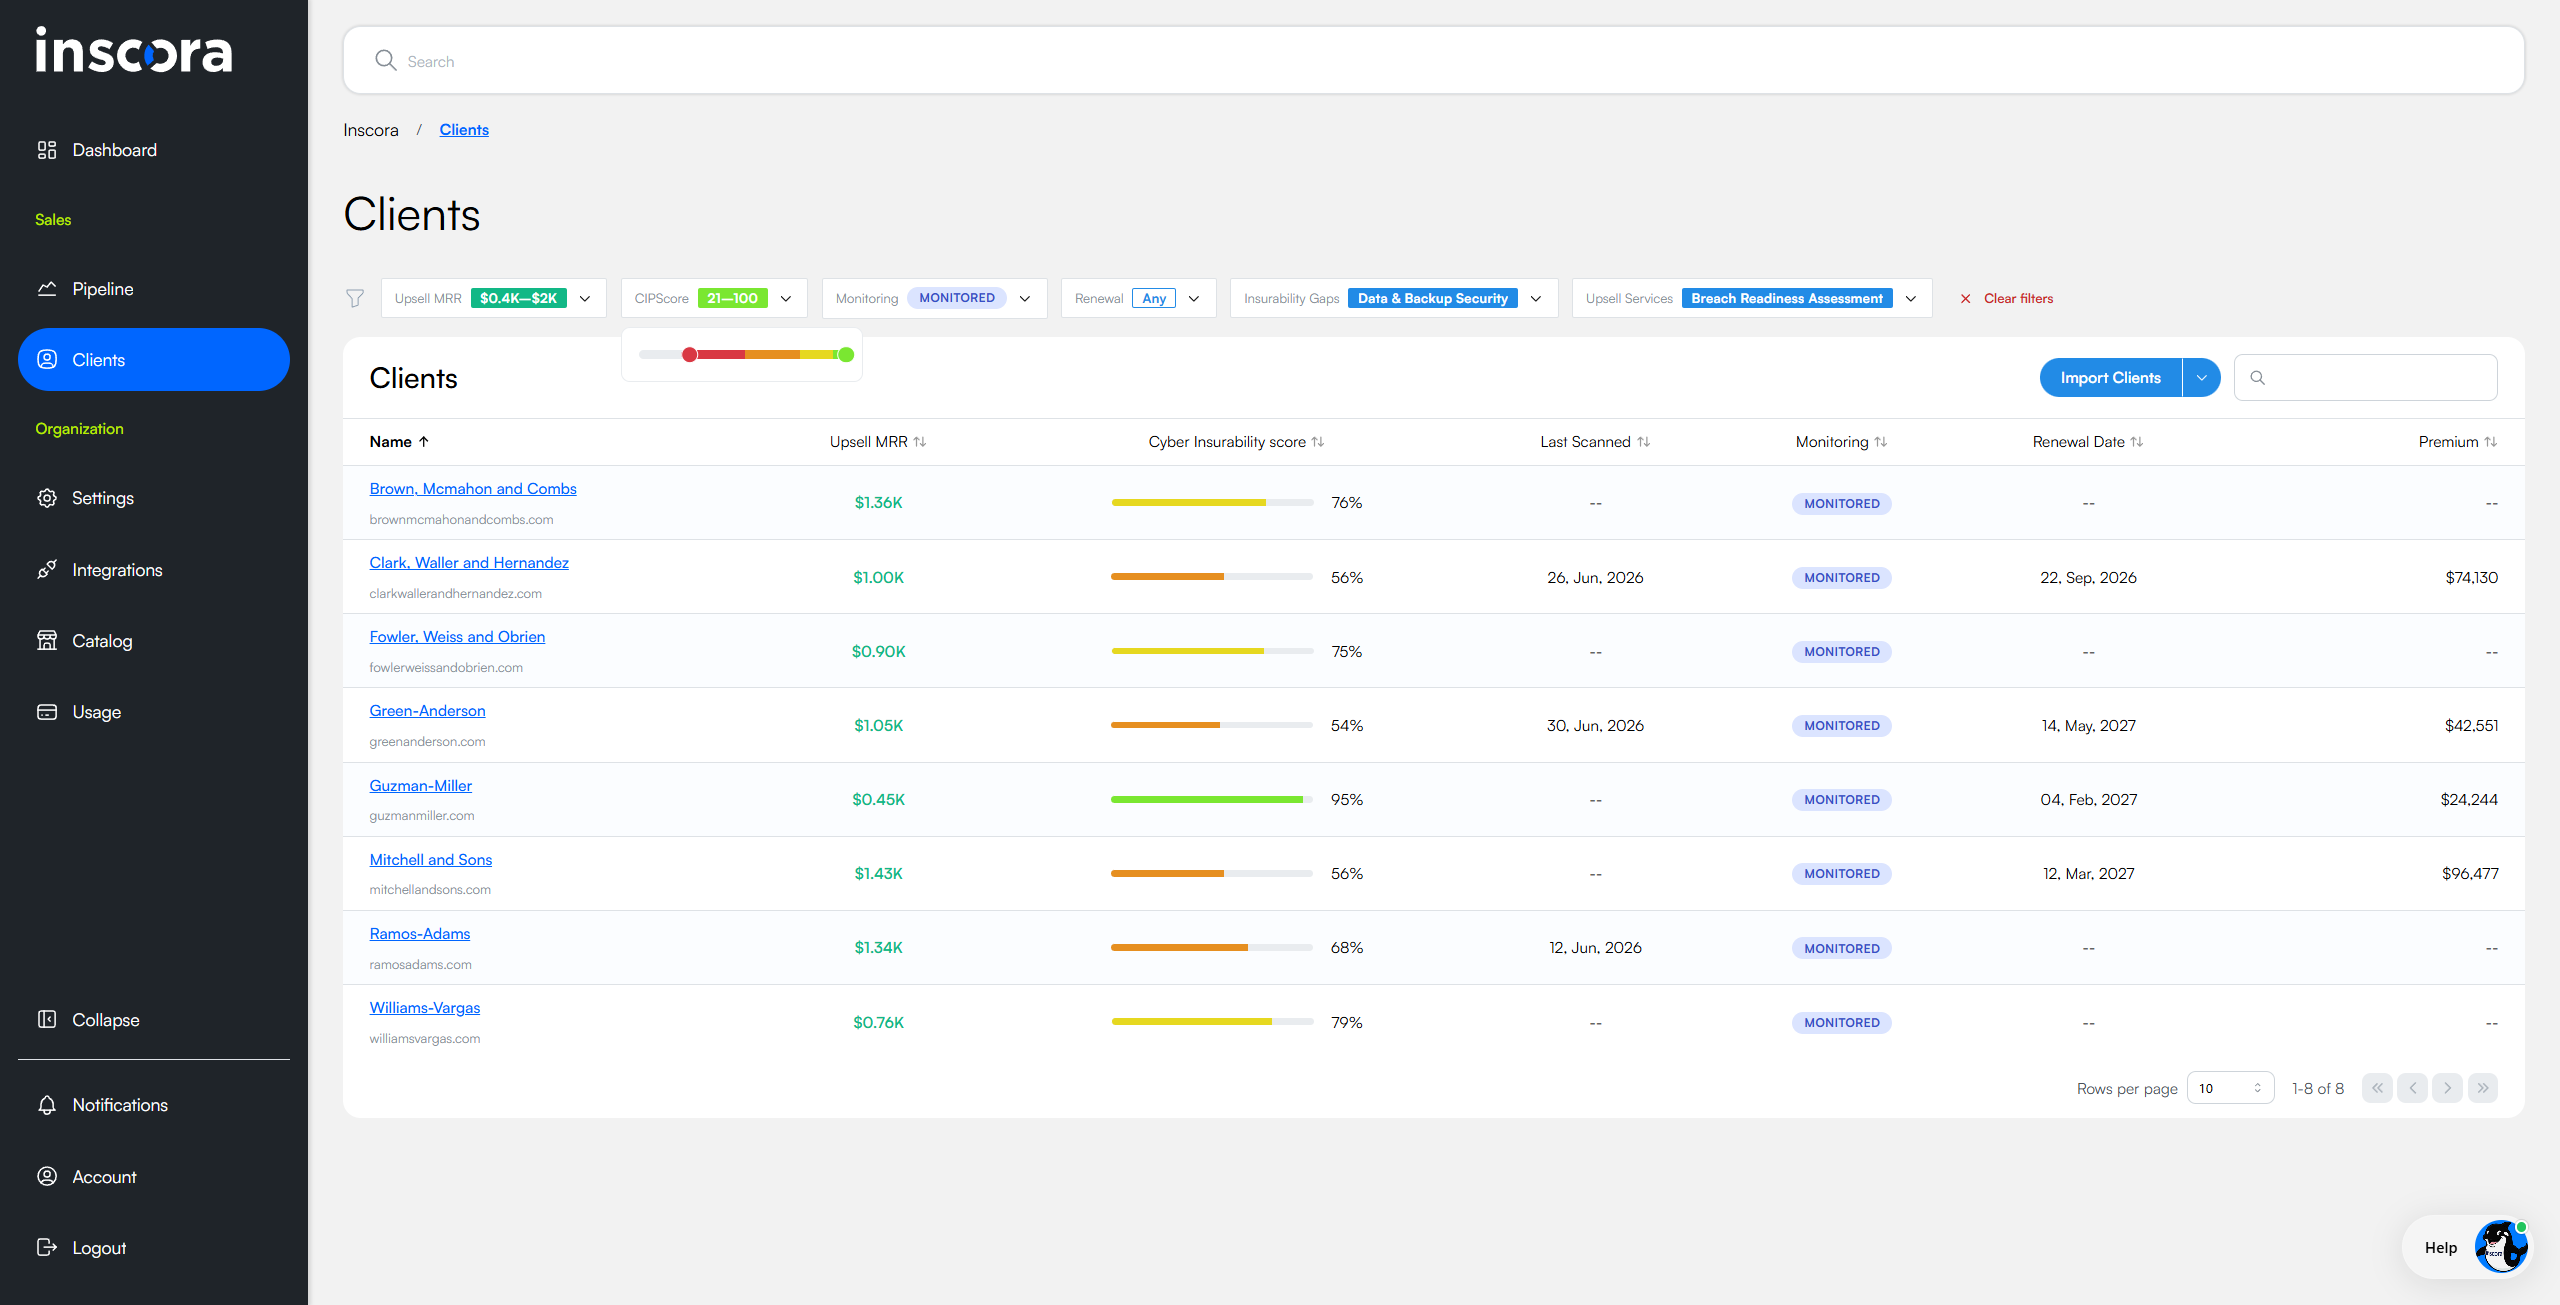
The Client List with filters applied, showing the sortable columns, monitoring status, and the filter row.
Adding Clients from the Client List
In the top-right of the Client List you'll find a blue Import Clients split button. The main button opens the Import Clients panel for bulk import from a connected PSA or a CSV file; the dropdown arrow exposes + Create Client for adding a single client by hand. See Add Clients for the full walk-through.
Filtering the Client List
A filter row sits just above the table. Open the filter menu and narrow the list by any combination of:
- Upsell MRR - the per-client opportunity.
- CIPScore - a 0-100 range, so you can isolate, say, only critical clients.
- Monitoring - All, Monitored, Warning, or No monitoring.
- Renewal - clients renewing soon.
- Insurability Gaps - pick one or more control areas to see only clients failing them.
- Upsell Services - pick one or more services to see the clients who need them.
Active filters stack, and a Clear filters control removes them all at once. The KPI cards and the revenue opportunity chart also drive this list - clicking a card or a chart node opens the Client List with the matching filter already applied. That's the intended loop: spot a problem on the Dashboard, see exactly which clients are affected, and act.
💡 Deep Analysis. Combine filters to find high-priority clients, for example low CIPScore plus a renewal within 30 days. Once you've found them, click into a client's CIPScore and open on any validation to understand the issue and prepare your conversation.
ℹ️ Looking for prospects? This page covers your active clients. Prospects have their own list under Prospecting: open Prospects in the sidebar.